
How to read the project overview
Written by Nutcache Team
Updated
The Overview tab is split into two sections: the Project Dashboard, which gives quick project KPIs and visual summaries, and the Project Tasks view, a searchable grid listing every task, assignees, planned dates, and time (estimated vs logged). Use the dashboard for high-level insight and the tasks view for detailed tracking and exports.
The Project Dashboard
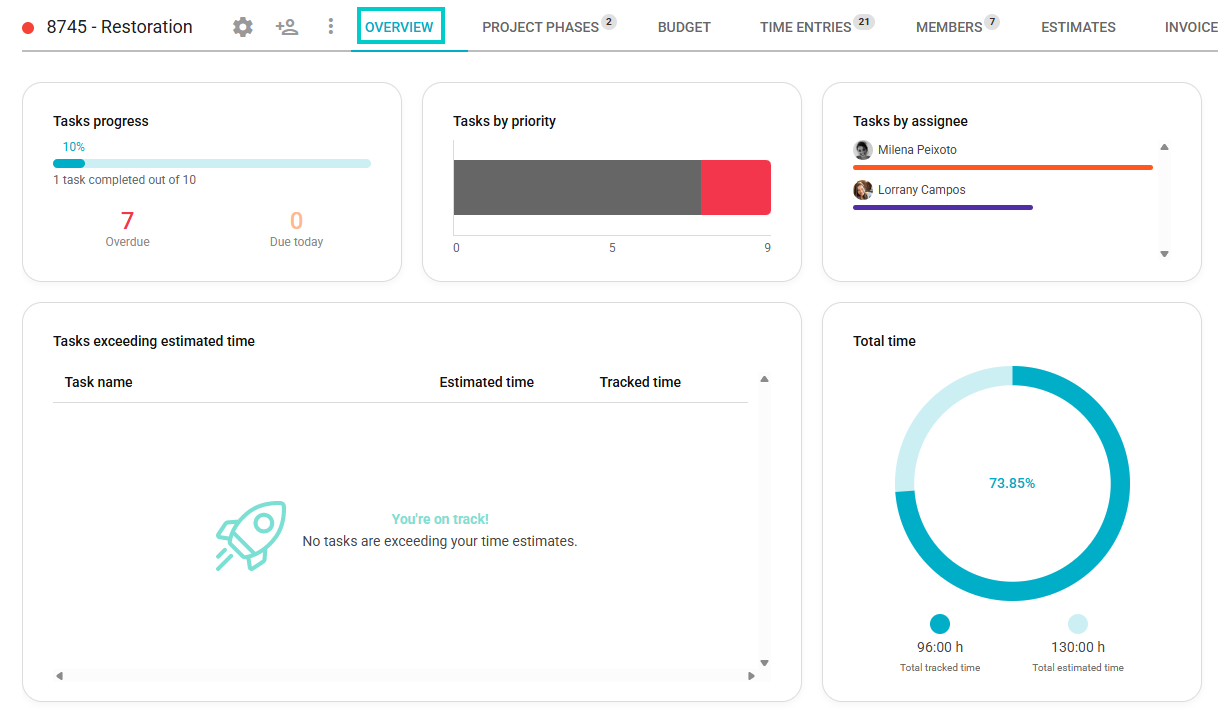
Track task completion
The Tasks progress panel shows the percentage of tasks that are marked as done.
It also allows you to have a quick glance at how many tasks in your project are overdue or due on the current day.
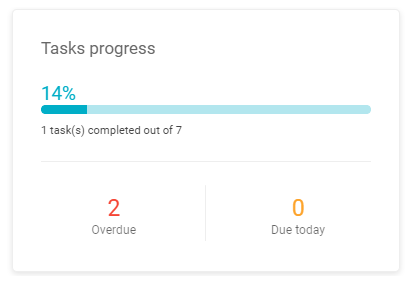
Track priority assignment
The Tasks by priority shows how many tasks have their priority set. If you hover with the cursor, it will also show the percentage of tasks with each priority.
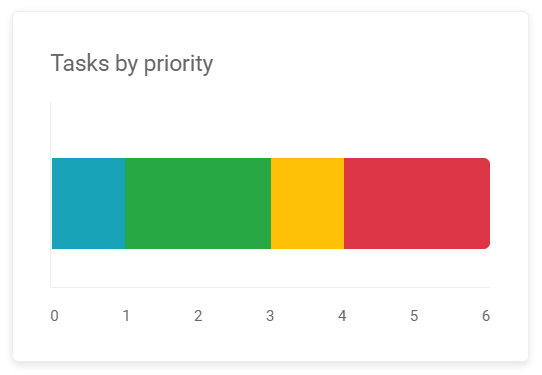
Keep track of member tasks
The Tasks by assignee panel shows how many tasks have been assigned to each member with assigned tasks in the project. Also, hovering over the name or bar of a member will show the number of tasks that member has been assigned to.
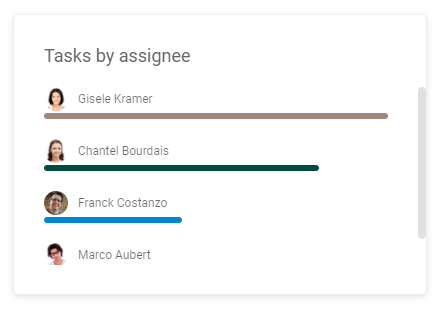
Keep track of your time
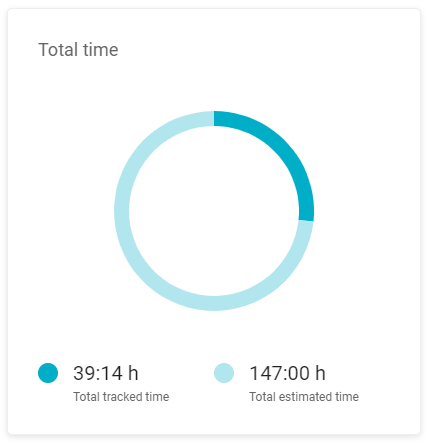
The Total time chart shows how much time you have estimated for the tasks in the project and how much time you have already spent. And you go over the estimated time it will turn red!
Spot tasks lagging behind
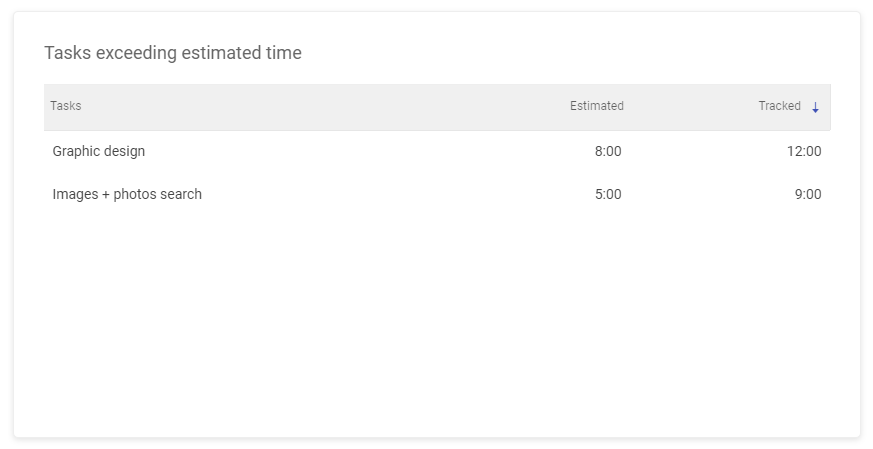
This grid will appear if you have uncompleted tasks that have exceeded their estimated time and that might require your special attention.
The Project Tasks view
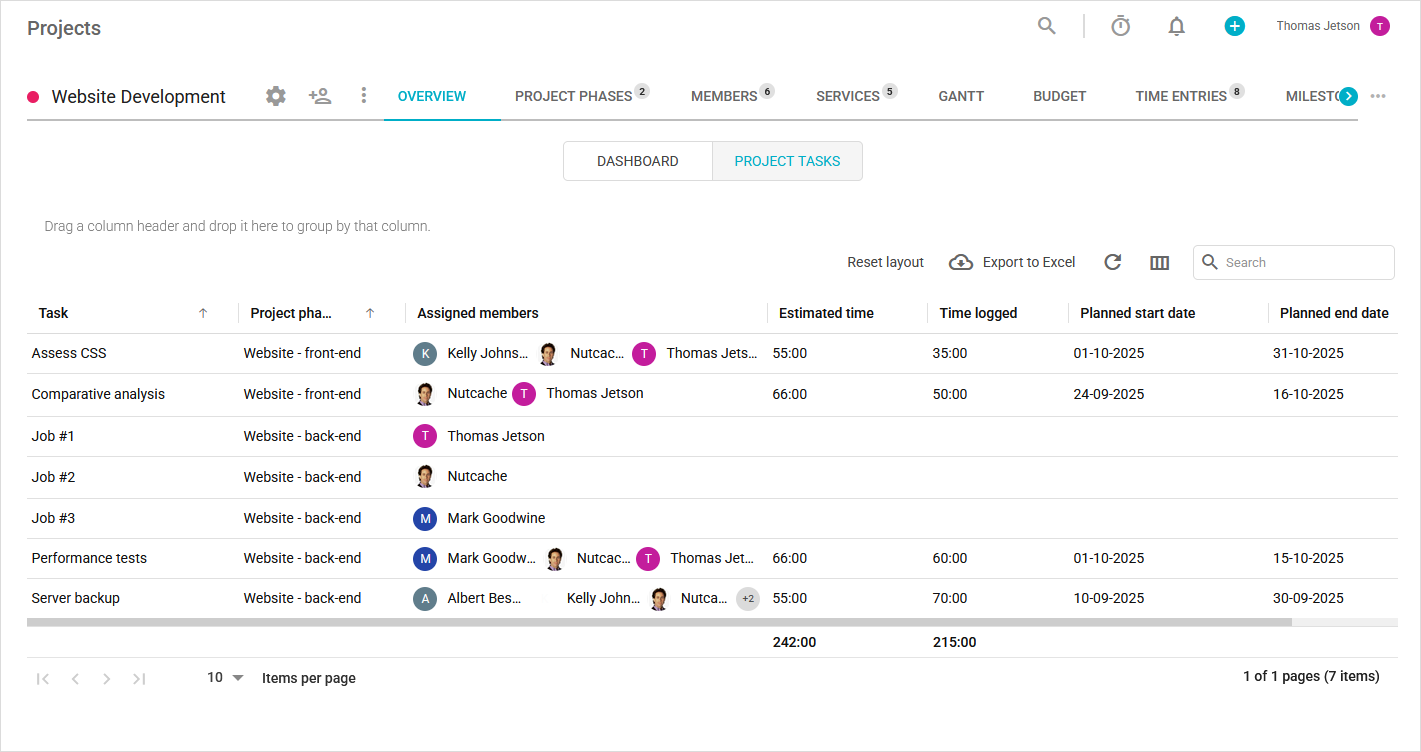
Project Tasks is a new, single-page view inside a project that lists every task created in that project and assigned to active members. Use it for fast status checks: who’s working on what, planned dates, estimated vs logged time, and simple exports.
What you’ll see (at a glance)
A compact, sortable tasks grid showing key columns: Task, Project phase, Assigned members, Estimated time, Time logged, Planned start date, Planned end date, etc..
A totals row at the bottom that sums the displayed Estimated time and Time logged so you can compare budgeted vs actual hours.
Practical examples
Project phase check: Group by Project phase to compare estimated vs logged time across workstreams.
Schedule review: Group by Planned start date or Planned end date to spot upcoming work or overdue tasks.
Stakeholder snapshot: Export to Excel and share the grouped/time totals with clients or managers.
Need a hand?
Our team can help you find the answer.
Contact us